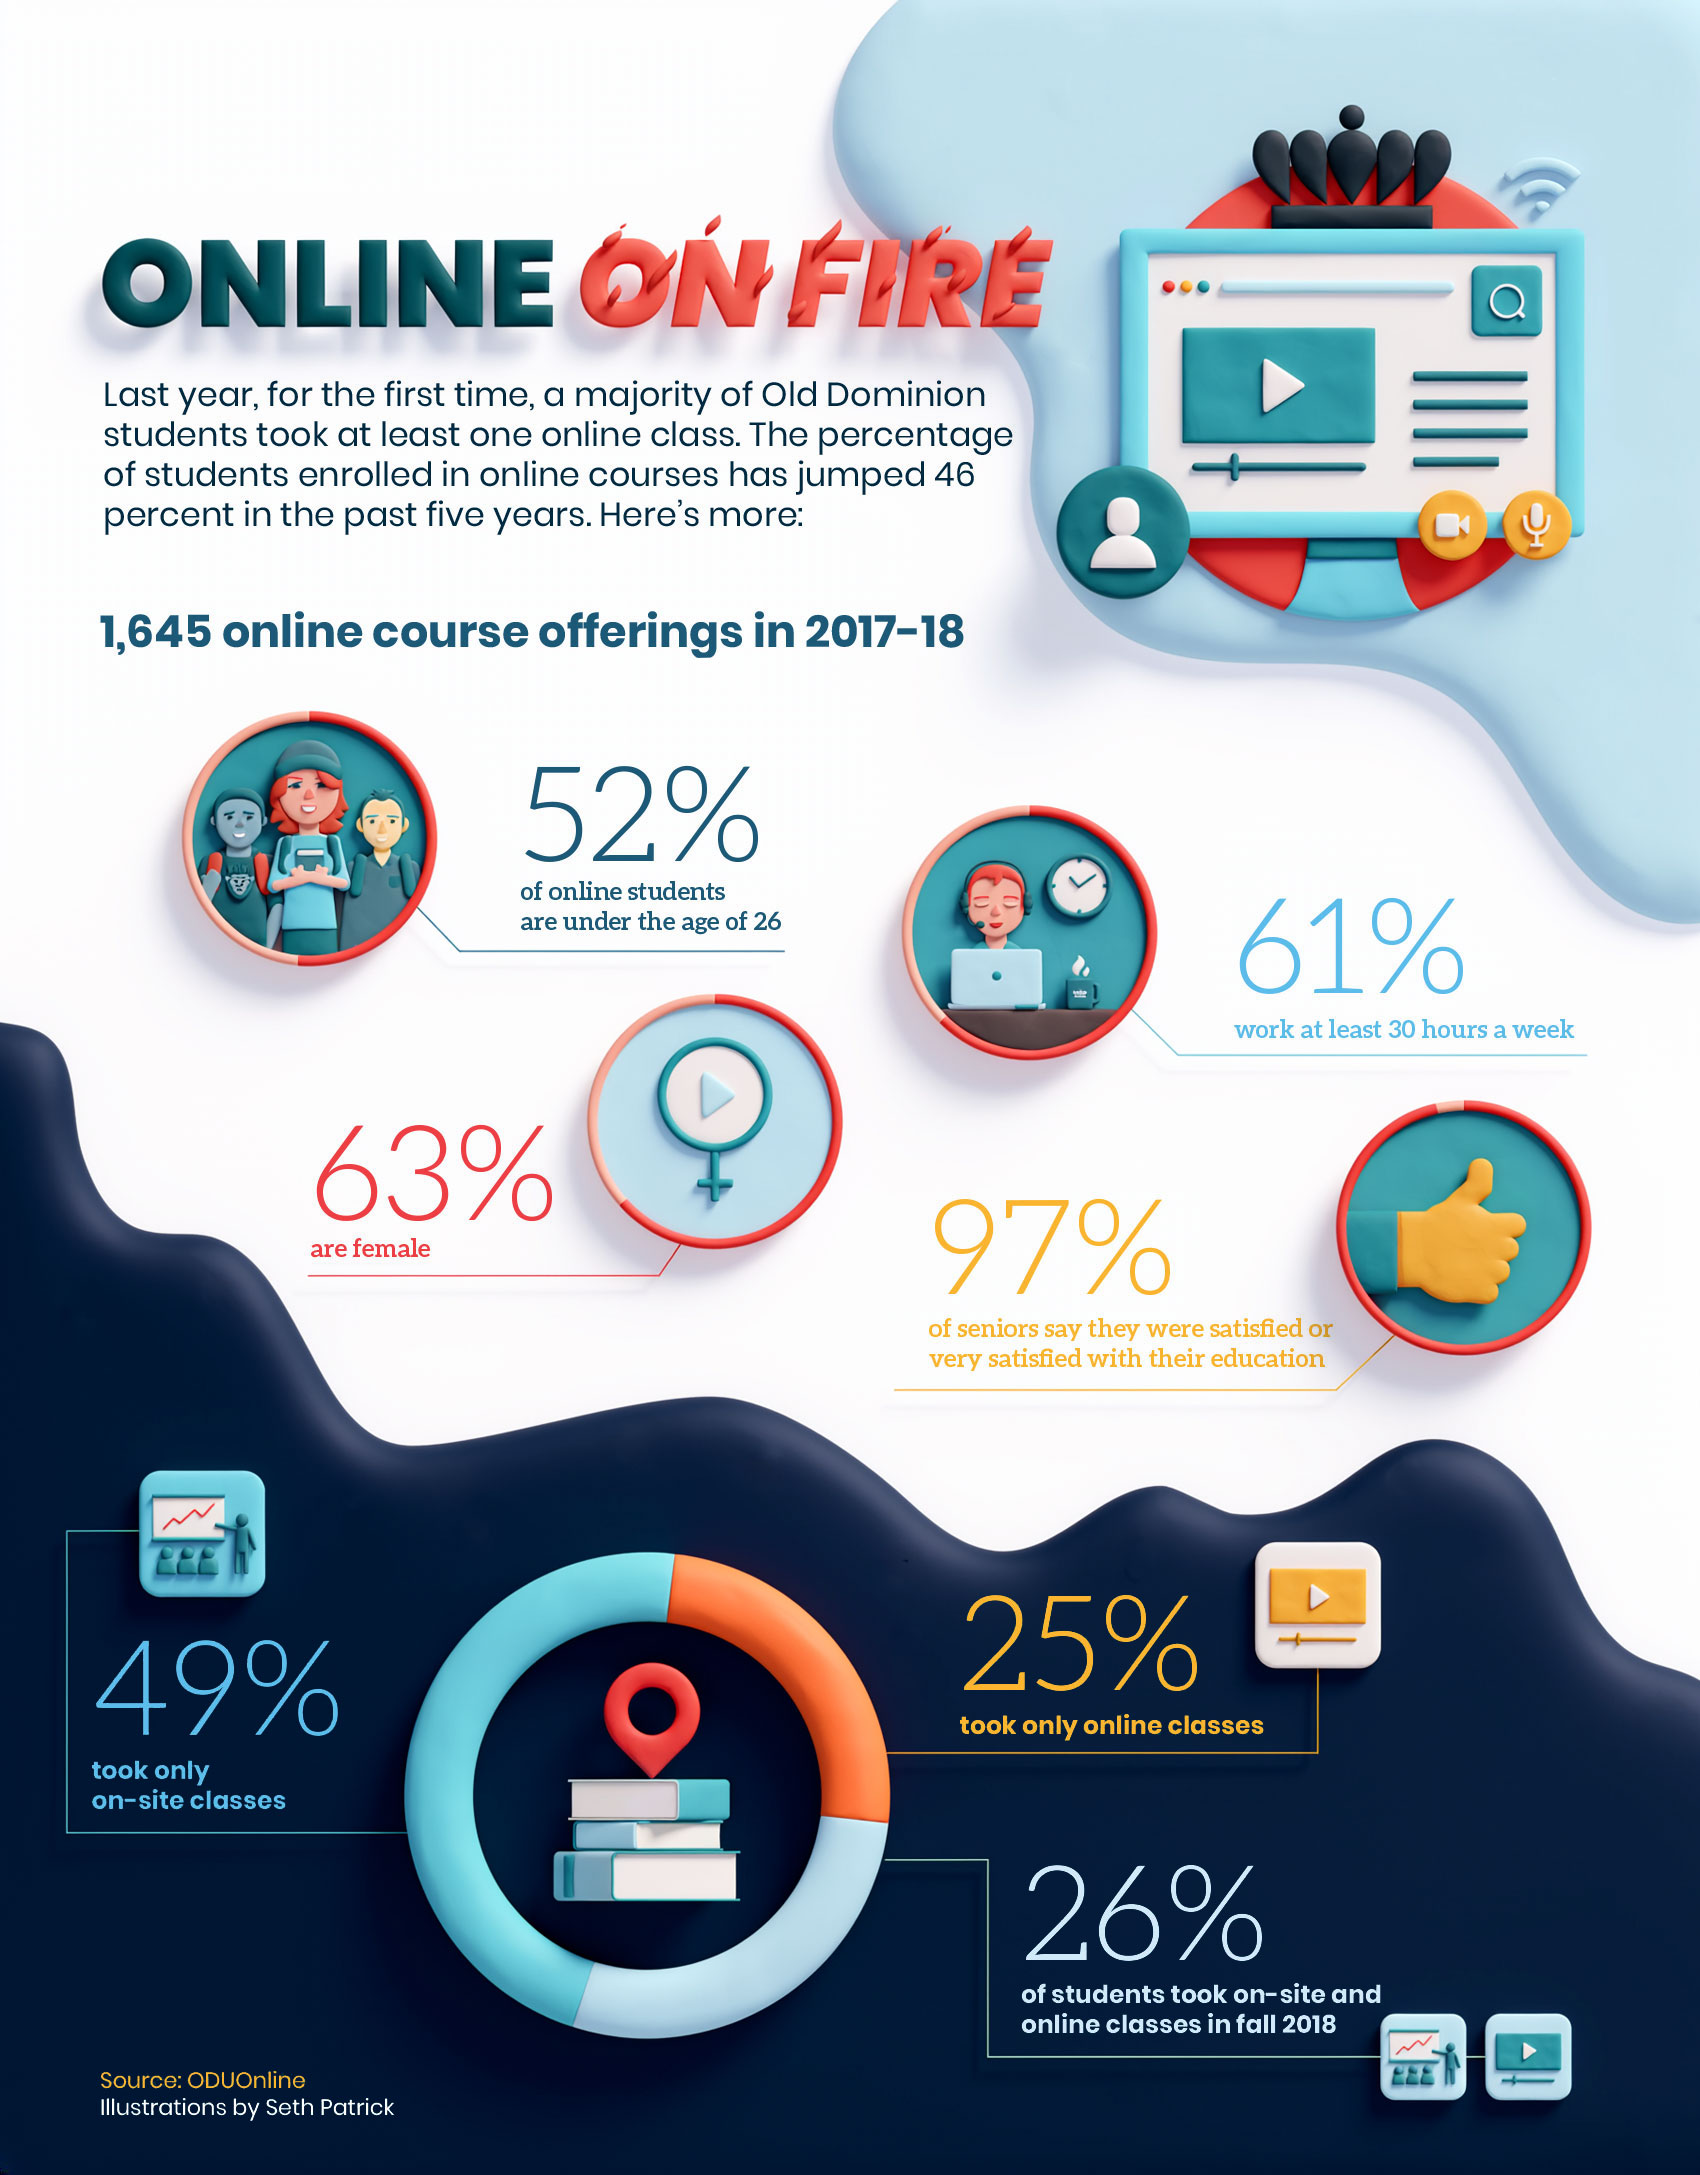
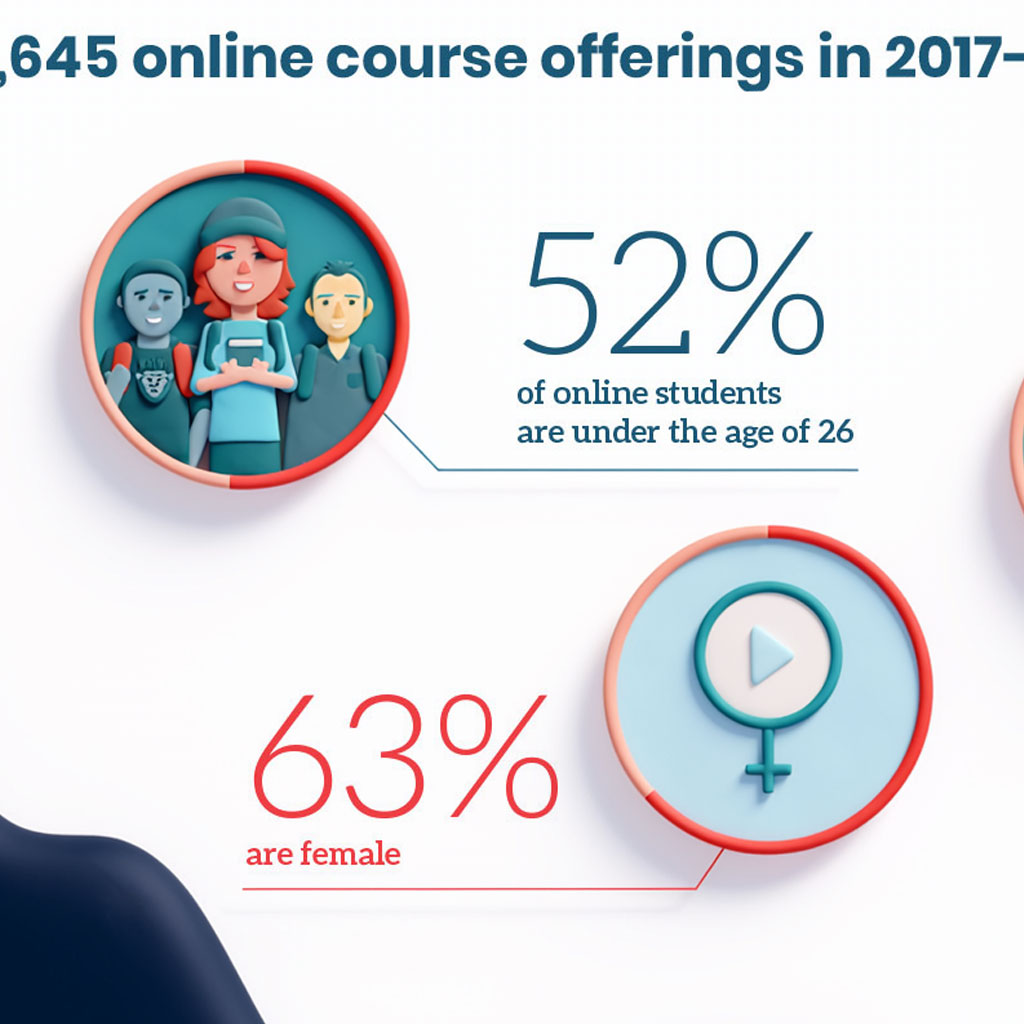
Rather than illustrating “online learning” with a single hero image, I broke the data into its own small 3D object for each stat — a presentation board with a rising line for the 61% working 30+ hours a week, a gender symbol built right into a play button for the 63% of online students who are female, a laptop screen with webcam and mic icons standing in for the online classroom itself. Keeping every object in that same soft clay-rendered style ties a dozen very different statistics together into one visual language, so the page reads as a system rather than a stack of separate charts.
Color did a lot of the organizing work here too — navy and red carry the headline and the big growth numbers, while teal and orange sort the supporting stats into their own lane, including a donut chart built from a stack of books and a location pin to show the on-site/online/hybrid split. The flame treatment on “ON FIRE” was a fun excuse to push the lettering a little more playful than usual, which felt right for a stat sheet that’s really a growth story.